My Tableau profile can be accessed here
Bar Chart
The dataset used for this visualization is one of Tableau’s inbuilt datasets – ‘Sample – Superstore’

Profit is denoted by blue hues while losses are denoted by yellow-red hues.
Line Chart
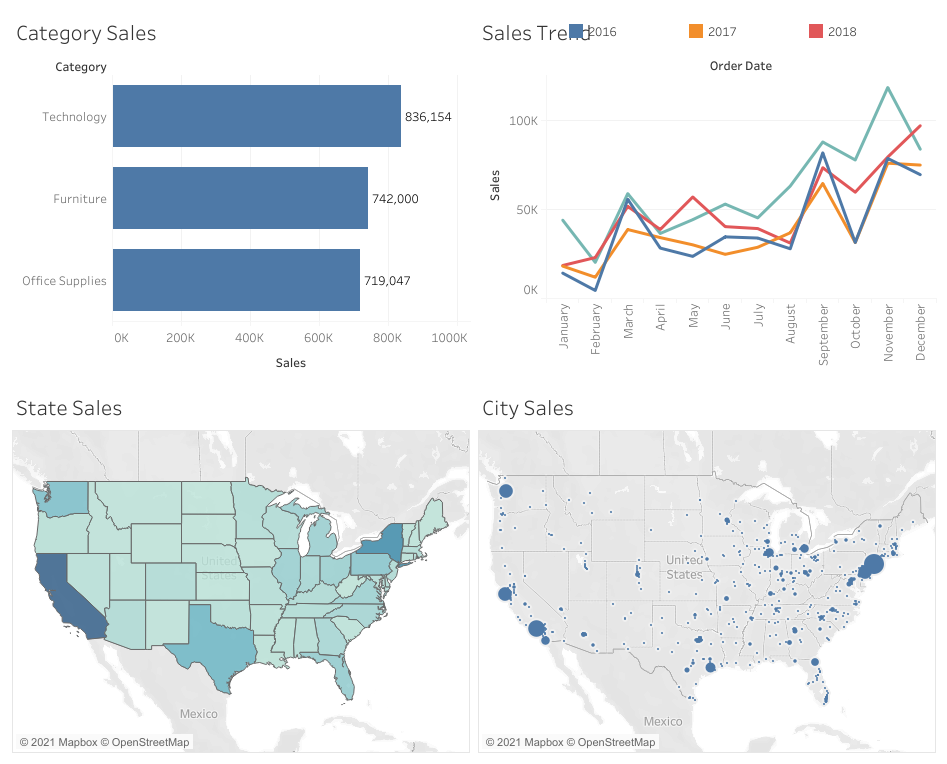
The same dataset was used to produce the following line chart

Line charts help to show trends in data.
Maps

The state sales map shows the sales performances by states.
Dashboard
The dashboard helps to create a narrative using the different charts visualized.