The dataset can be obtained here.
The heart dataset comprises of the following variables:
Age: The Age of the patients in years.
Sex: The sex of the patients (1 = male, 0 = female)
Chest_Pain_Type: The chest pain type experienced by the patients (Value 1: typical angina, Value 2: atypical angina, Value 3: non-anginal pain, Value 4: asymptomatic)
Resting_BP: The person’s resting blood pressure (mm Hg on admission to the hospital)
Serum_Cho: The person’s cholesterol measurement in mg/dl
High_Fbs: The person’s fasting blood sugar (> 120 mg/dl, 1 = true; 0 = false)
Resting_ECG: Resting electrocardiographic measurement (0 = normal, 1 = having ST-T wave abnormality, 2 = showing probable or definite left ventricular hypertrophy by Estes’ criteria)
Heart_Rate_Max: The patient’s maximum heart rate achieved.
Ex_Ang: Exercise induced angina? (1 = yes; 0 = no)
Old_Peak: ST depression induced by exercise relative to rest.
Slope: Slope of the peak exercise ST segment (Value 1: upsloping, Value 2: flat, Value 3: downsloping)
FCBV: The number of major vessels colored by flourosopy (0-3)
Thal: A blood disorder called thalassemia (3 = normal; 6 = fixed defect; 7 = reversable defect)
Diagnosis: Heart disease (0 = no, 1 = yes)
>h2_normality<-ggplot(data=Heart_data, aes( x=Serum_Cho))
>h2_normality+geom_histogram(binwidth=10,aes (fill=Diagnosis), color="Black")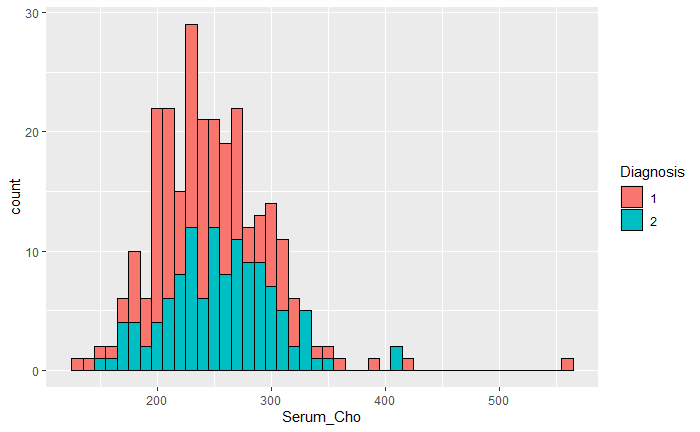
The histogram shows a fairly normal distribution. I checked for homogeneity of variance using the Levene’s test.
>library('car')
>leveneTest( Serum_Cho~ Resting_ECG*Diagnosis, data = Heart_data)
Levene's Test for Homogeneity of Variance (center = median)
Df F value Pr(>F)
group 5 0.7864 0.5603
264 From the output, it can be observed that the p-value is not less than the significance level of 0.05. This shows a lack of evidence to suggest that the variance across groups is statistically significantly different. Therefore, we can assume the homogeneity of variances in the different groups.